In the golden era of Universal Analytics (UA), Google pre-packaged a comforting array of reporting right out of the box. But, as companies transition to Google Analytics 4 (GA4) in preparation for UA’s planned sunset in 2023, marketers have been surprised to find far fewer of those pre-set analysis tools, and many are scrambling to rebuild the reports they rely on for key metrics.
For example, if you check your UA account for acquisition, you’ll find roughly 25 different reports you can tap into right away. If you check acquisition in Google Analytics, on the other hand, you’ll see an overview screen and…two reports.
But there’s no need to panic. While switching from UA means you give up those pre-packaged reports, what you gain from GA4 is the opportunity to collect data and analyze it in ways that make the most sense for your business.
In this article, we’ll point you to places where you can find the UA reports you’re used to in GA4, and then we’ll show you how to build GA4 custom reports that fit your business needs. Forget the good old days. The best is yet to come.
Find your favorite UA reports in GA4
While you might not be able to find a one-to-one match for everything you’re used to using in UA, GA4 does offer some reasonable facsimiles, although the naming may be different.
Acquisition Reporting → Traffic Acquisition
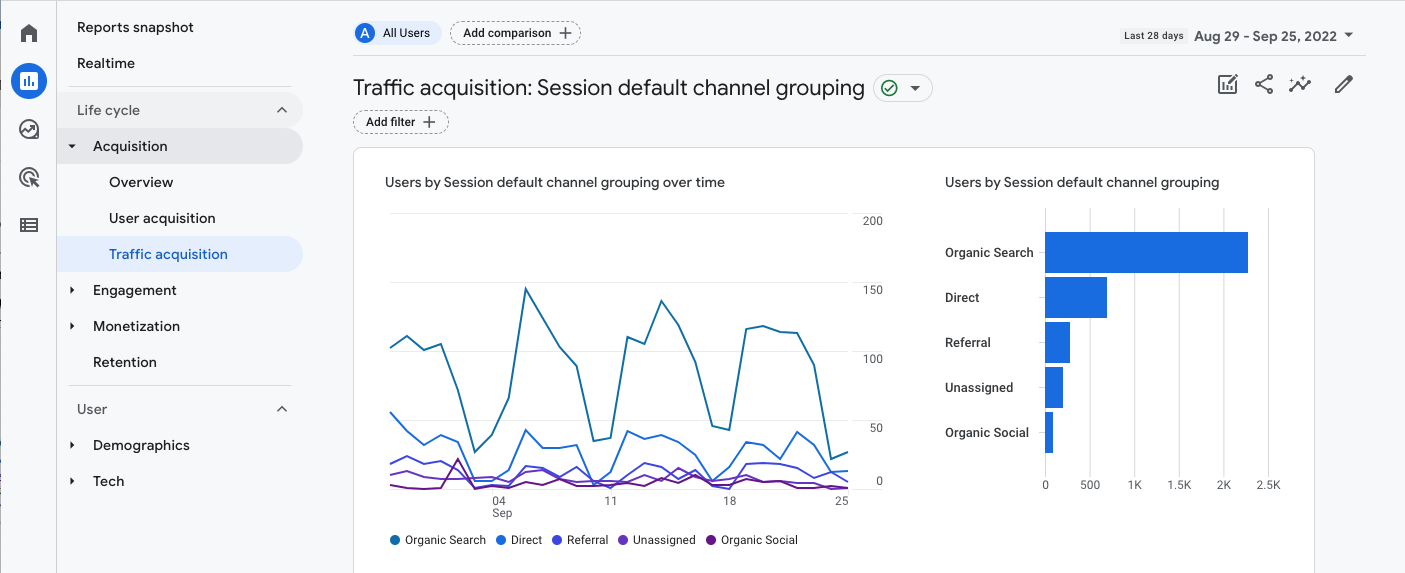
If you use UA’s Acquisition Reporting to answer questions about website traffic, you can find some similar metrics in GA4’s Traffic Acquisition. You’ll notice that Traffic Acquisition is set up in a similar format, but — and this is a big hurdle — you won’t be able to drill down into the data with a few quick clicks in GA4 like you can in UA.
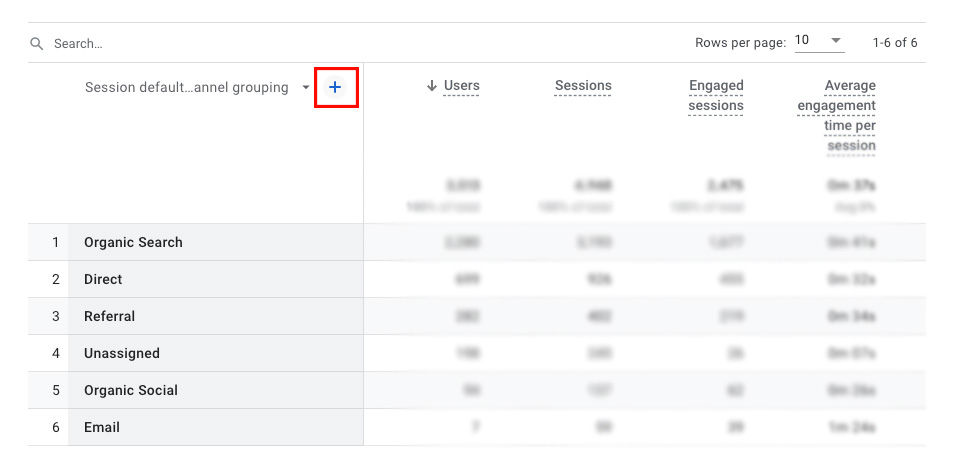
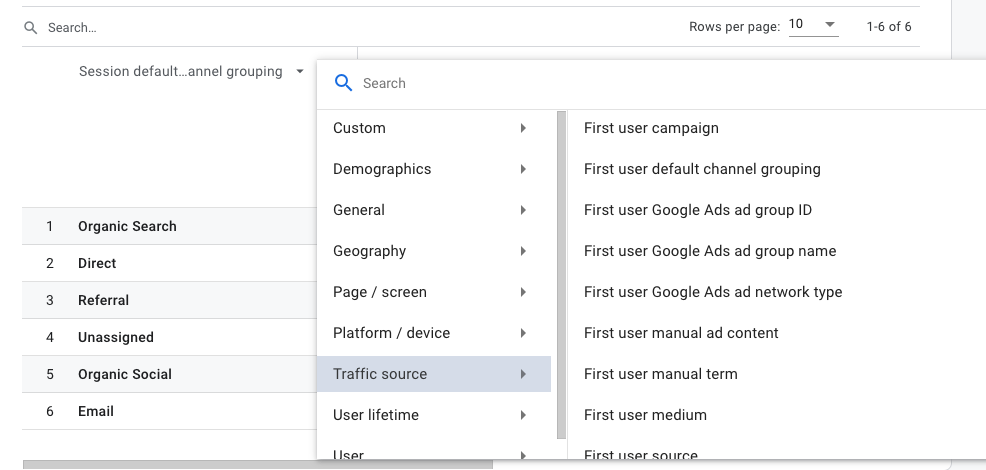
In GA4, instead of clicking around to find information, you use the plus sign (+) to set up secondary dimensions when you want to drill down into information. As you set up secondary dimensions, you’ll be able to search and narrow down the data to determine the best way to answer the questions your business is asking. In this case, GA4 shows you the same information you found in UA, but in a more targeted, deliberate format.
Bounce Rate → Engagement Rate
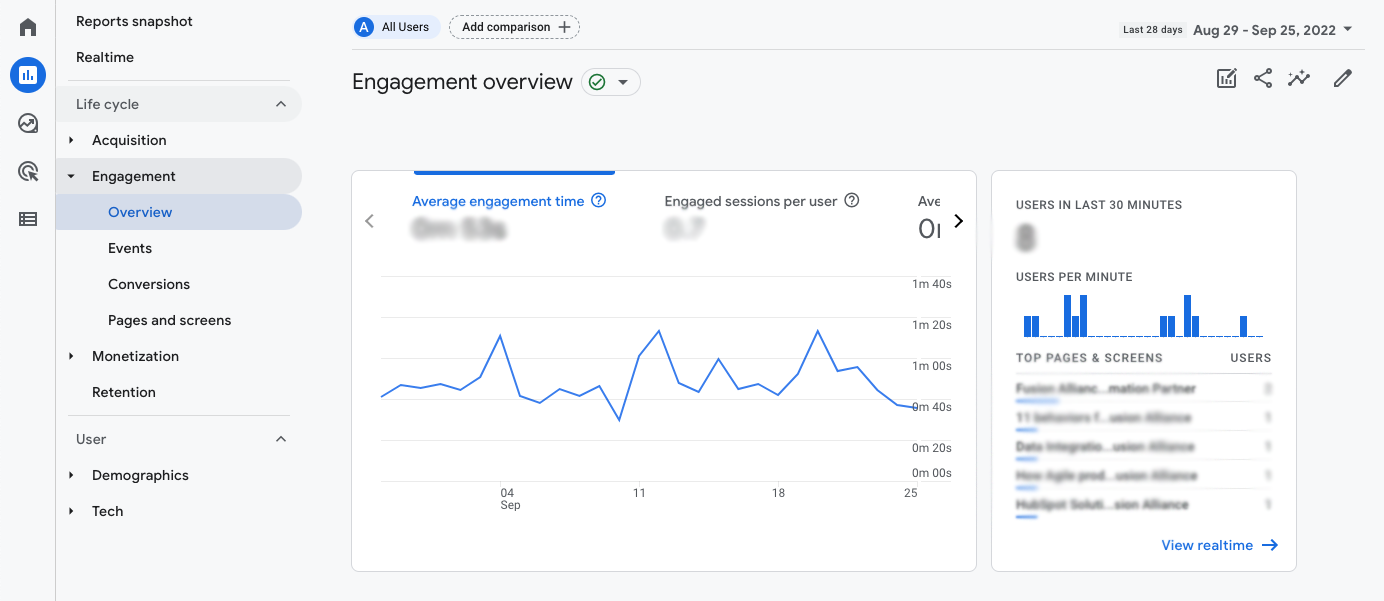
At first, it seemed bounce rate had bounced out of the analytics arsenal entirely with GA4, but now it seems the metric most responsible for marketing panic attacks is back, but in a slightly different form. Bounce rate does exist in GA4, but it’s calculated a bit differently because of GA4’s different data model. So, if you compare your current UA bounce rate to GA4, you will see a difference, and you’ll need to set new benchmarks.
GA4 introduced a new metric to try and give us better information about how visitors use our websites: engagement rate. Unlike UA’s bounce rate, GA4’s engagement rate measures people who stay on your site and actually stay engaged. It’s a bit more dimensional than bounce rate, but also a little more difficult to manipulate. You can export engagement rate data into Excel if you’re up for doing a little more digging, but this report is one that might benefit from customization.
Audience Overview → Demographics Overview
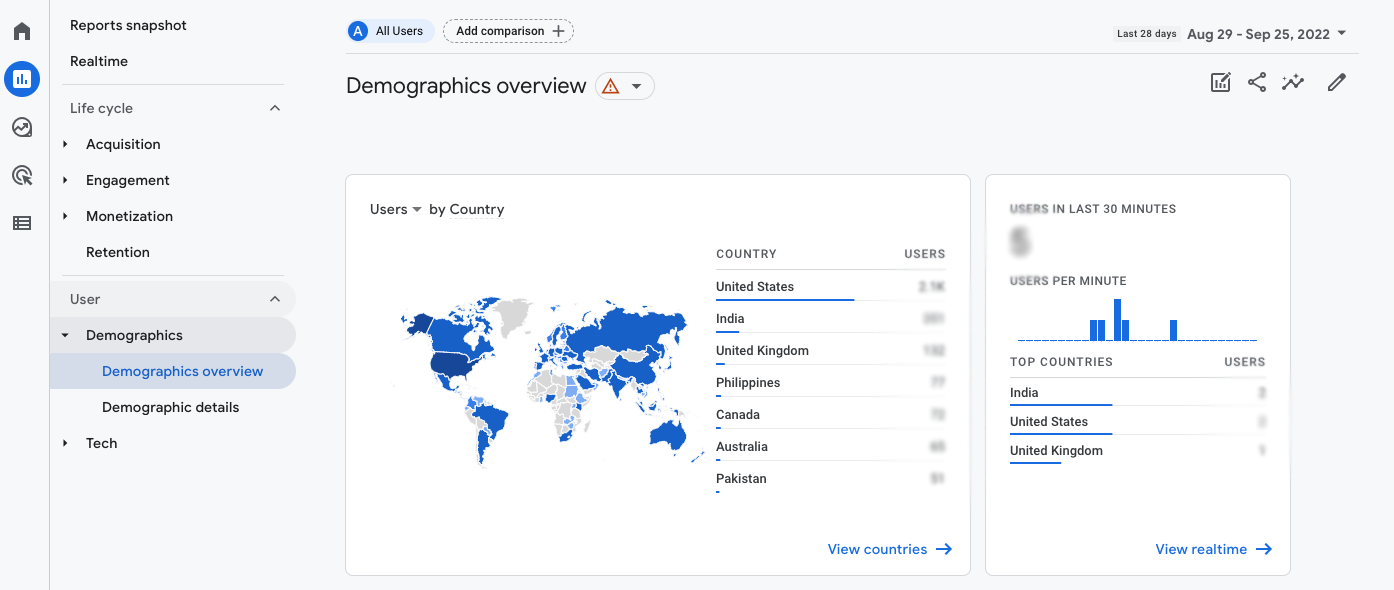
Similar name, same functionality! As in UA, in GA4, Demographics Overview gives you a quick snapshot of your users, including:
- New vs returning users
- Demographic data
- Browser and operating system access
Content Drill-Down → Pages & Screens Report
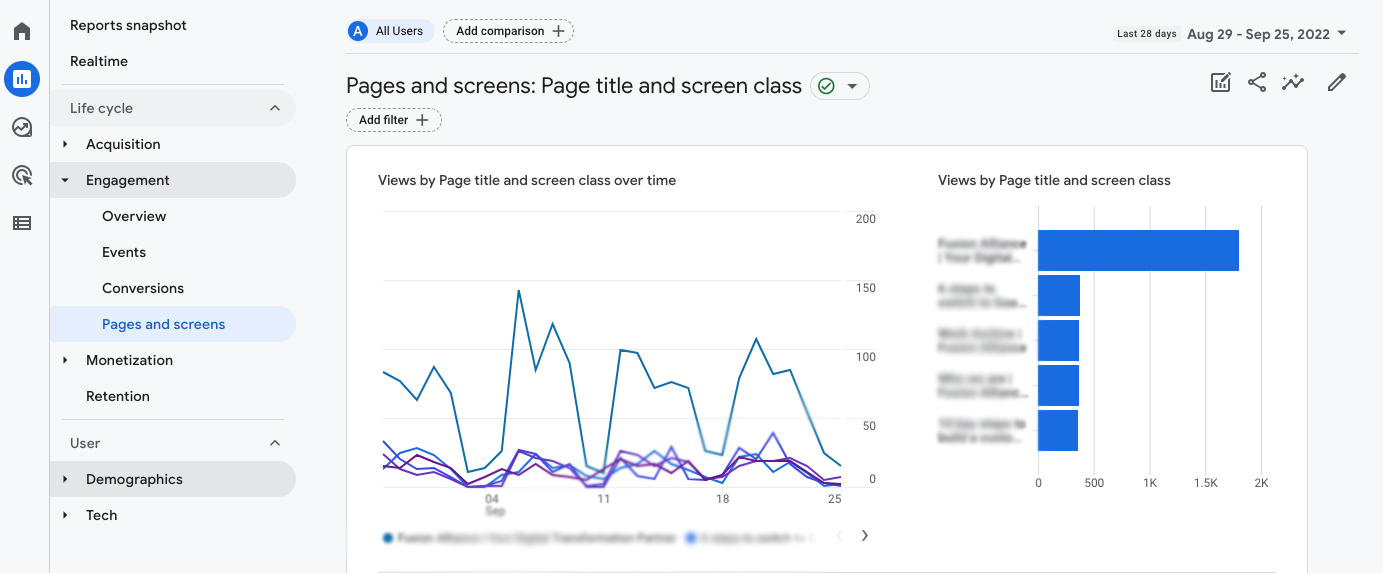
In UA, the Content Drill-Down report gives a view of how site content performs at a hierarchical level within the URL structure. In GA4’s Page & Screens Report, on the other hand, you see your content by page title, but not by section.
You can change the GA4 report view to page path, which allows a little bit more clarity, but the interface doesn’t support clicking around into different sections and paths. A few workarounds may help:
- Use the search function to look up different sections of your website, like “blog,” “about,” “services,” and so forth
- Export content to Excel to group and compare different sections against each other
- Use Explorations rather than Pages & Screens to dig into specific content performance questions
Explorations

When you can’t find a 1:1 match for a UA report you used to rely on, you could use GA4’s Explorations function to rebuild an exact match, but you could also take the opportunity to fine-tune the report to answer questions in an even better way.
Within the GA4 Explore tab, users can build their own detailed reports, called Explorations, from a gallery of templates. We expect that this library will continue to grow but the baseline options are already quite useful.
Of course, as you build out your own custom GA4 reports, you’ll want to start from a list of defined questions that serve your own internal goals, KPIs, and requirements. But to help you get the hang of how to create your own Explorations, we’ll outline a few examples here, based on UA reports you may be used to using.
Behavior Flow → Path Exploration

This report delivers a segmented view of website traffic. For example, to find out how many site visitors get to your contact page via organic search, you can create a path exploration by:
- Navigating to the GA4 Explore tab
- Choosing the path exploration template
- Clicking organic search sector
- Clicking the path to find how many of the visitors in this segment visited the contact page
Behavior Flow → Funnel Report
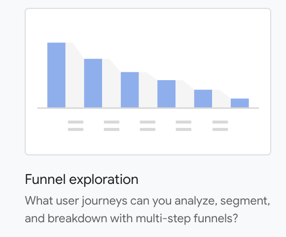
You can create a similar version of the path exploration report with a funnel report, adding more detail about the steps you want to analyze. You can set this report up by:
- Navigating to the GA4 Explore tab
- Choosing the path exploration template
- Clicking organic search sector
- Clicking the path to find how many of the visitors in this segment visited the contact page
- Adding form submission as a requirement
- Editing and adding steps to change the desired action
This report can give you a better idea of common visitor behavior flows on your website. It’s a highly customizable GA4 report, both by steps and the dimensions of behavior you can track those journeys across the site.
Exit Pages → Free Form Explorations
Although you can’t find exit pages and exit page percentages out-of-the-box with GA4 as you can in UA, you can use free-form explorations to create a custom GA4 report to get you that data. Here’s the setup process at a high level:
- Navigate to the GA4 Explore tab
- Select the Free Form Exploration template
- Set up the page path you’re tracking, including exits and sessions
- Compare which pages have the most exits to total sessions to get the percentage
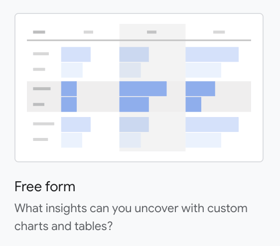
While you can’t find the percentage in a calculated column, this report is a helpful replacement if you need to find this data quickly. Using Free Form Explorations, you can take any of your metrics and add any dimensions to home in on your data at a very close level.
More options for building GA4 custom reports
As you dig into GA4, you may find that you can add new dimensions and metrics to the tables for some of GA4’s limited out-of-the-box reports, but you may find that the results lack the depth you need.
Depending on the types of reporting you need, you may also find that Explorations give you enough common views to replace most of what you find in UA.
However, most marketers will need to get a step further in their GA4 reports before completely moving away from UA. With GA4 still in flux and new features and functionality shifting, Looker Studio (formerly Google Data Studio) may offer your team a way to find consistency and recreate some of the views you were used to using in UA with your GA4 data.
Shifting from UA outputs to GA4 custom reports isn’t easy
To make the switch from UA to GA4 seamless, you might need to call in reinforcements. Check out our GA4 resources or let us know if you have a specific question. Our team is helping mid-size businesses and enterprise-level organizations handle every aspect of the GA4 transition, and we’re happy to help you get what you need to be successful.
[Match-up] Understand the differences between Universal Analytics and Google Analytics 4
[Path] What you need to know to upgrade to GA4
[Plan] 6 steps to make your Google Analytics 4 transition easier
[Video] Meet the new Google Analytics 4


